

Data visualization: a successful design process
by Kirk, Andy
fromCommunity experience distilled


"Unlike any time before in our lives, we have access to vast amounts of free information. With the right tools, we can start to make sense of all this data to see patterns and trends that would otherwise be invisible to us. By transforming numbers into graphical shapes, we allow…

"This volume presents an overview of the state of the art in data visualization, encompassing correspondence analysis, nonlinear principal component analysis, cluster analysis, multidimensional scaling, and much more. It covers the historical development of each topic along with…

"This volume presents an overview of the state of the art in data visualization, encompassing correspondence analysis, nonlinear principal component analysis, cluster analysis, multidimensional scaling, and much more. It covers the historical development of each topic along with…

The author uses examples from art, design, business, statistics, cartography, and online media, to explore concepts and ideas about illustrating data.


Author Scott Murray teaches you the fundamental concepts and methods of D3, a JavaScript library that lets you express data visually in a web browser

A picture is worth a thousand words, but what if there are a billion words? When analyzing big data, you need a picture that cuts through the noise. This is where infographics come in. Infographics are a representation of information in a graphic format designed to make the data…

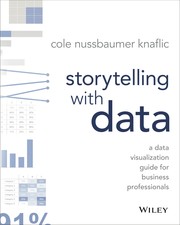
Sometimes it is easy to generate charts and graphs look fine to you, but don't clearly communicate the information that they represent. Knaflic's own knack for clarity will help you sharpen your message when using data in your business presentations. "Storytelling with Data tea…


